.png)
Country full of contrasts
Did you know the Netherlands has the fifth-largest economy in the European Union? And that the country of the bikes, tulips, cheese, and charming canals also ranks among the top 5 happiest countries, according to the most recent happiness report released in 2023?
Despite the high living standards, there is still a fraction of households in The Netherlands living below the social minimum. Sadly, these families likely don’t even have enough income to meet their need for food. Here is where VoedselBank Nederland (VBN), the primary Dutch Food Bank comes to the rescue.
Currently, VBN has 10 distribution centers that collect donated food and distribute it to 177 local food banks situated throughout the country. In 2020, approximately 150,000 individuals benefited from the support of the Dutch food banks, which is already an impressive amount. However, due to language barriers, social stigma, or inaccessibility of the Food banks, the number of households in the Netherlands that need support might be higher. Therefore, in 2020, VBN and the Zero Hunger Lab at Tilburg University joined forces to develop techniques for predicting the number of people eligible for Food Bank support. The project’s pilot phase, conducted in the city of Den Bosch, focused specifically on predicting households living below the poverty line.
Food for thought
At Kickstart AI, we wanted to utilize our technical expertise to assist VBN in reaching not only vulnerable households in one city, but all households in need of food across the country. Just imagine the impact it would make if they can predict the number of households below the social minimum (along with the contributing factors), enabling them to make strategic decisions and better target households in need of support. Through the combination of open-source libraries and machine learning algorithms, we could discover practical solutions.
Everything starts with data
To understand the factors contributing to households falling below the social minimum and the regions in The Netherlands where they are located, we used historical Dutch census (CBS) data from 345 municipalities. The CBS data contained information on a broad range of topics that can be organized into different categories: proximity to facilities, housing, companies, population, economy, region, energy consumption, type of household, income, migration background, crime, and transportation.
Since the percentage of households below the social minimum offers the most relevant insight into our predictive goals, we have focused on this when developing the predictive AI model. When determining this feature, CBS used private households where the main breadwinner (or in some circumstances their partner) has an income all year round and is not dependent on student finance. If the established standard social minimum incomes are used as an income limit, many households that rely exclusively on social assistance benefits will have an income just above the threshold. Therefore, we used the CBS estimates of income up to 101% of the social minimum as our target.
The CBS updates the fraction of households below the social minimum annually with a one-year lag, so we assume the 2022 and 2023 figures remain similar to 2021's.
Read more: Our Summer of AI Challenge: Using Data to Predict Food Insecurity
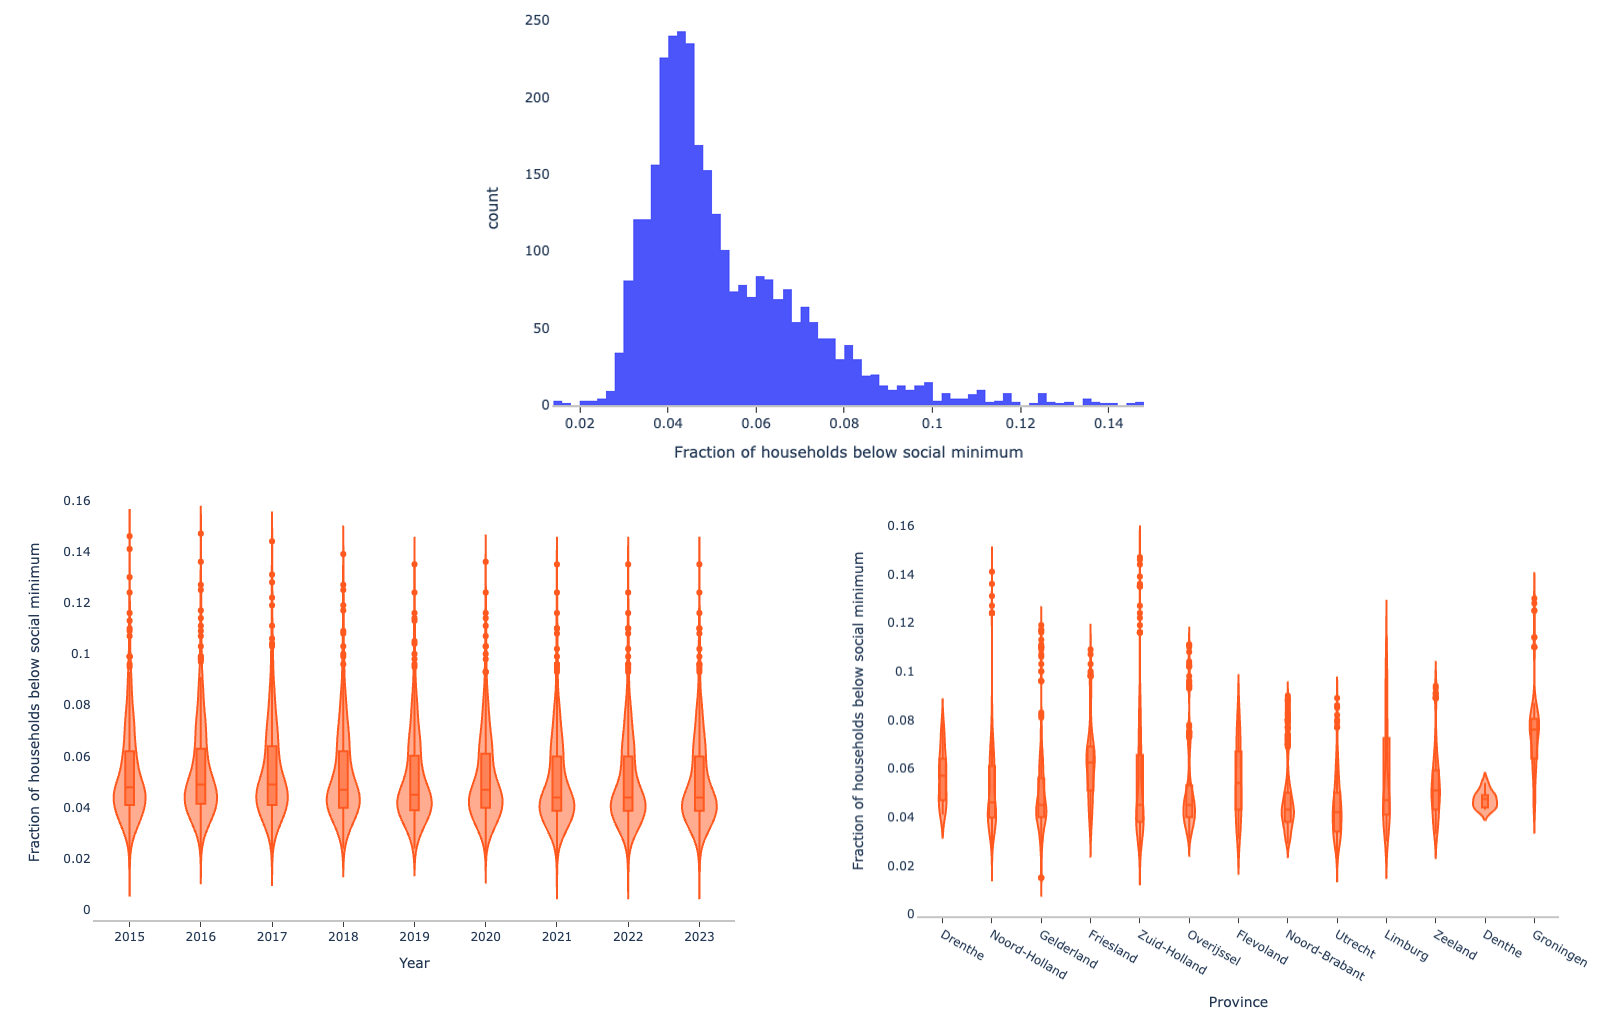
Figure 1: Top: Distribution of the target of our model. Bottom: Target distribution over the years (left) and over the Dutch provinces (right).
As you can see in Figure 1, the distribution of the fraction of households below the social minimum remains relatively consistent over time. However, it’s important to note that the distribution depends highly on the location. Therefore, our model needed to cover all 345 municipalities to ensure our analysis is fair and accurate. To achieve this, we trained our model using data from 2015 to 2022 and tested it with data from 2023.
Big cities. Bigger issues
Here is another figure. In Figure 2, we see that the region plays the most crucial role in determining the fraction of vulnerable households. Where Rotterdam proudly claims the number 1 spot in many positive lists, it unfortunately holds the same position in the percentage of households below the social minimum. Other factors related to poverty include the distance to facilities and housing. One key takeaway here is that areas with higher average house values typically tend to have fewer households in need.
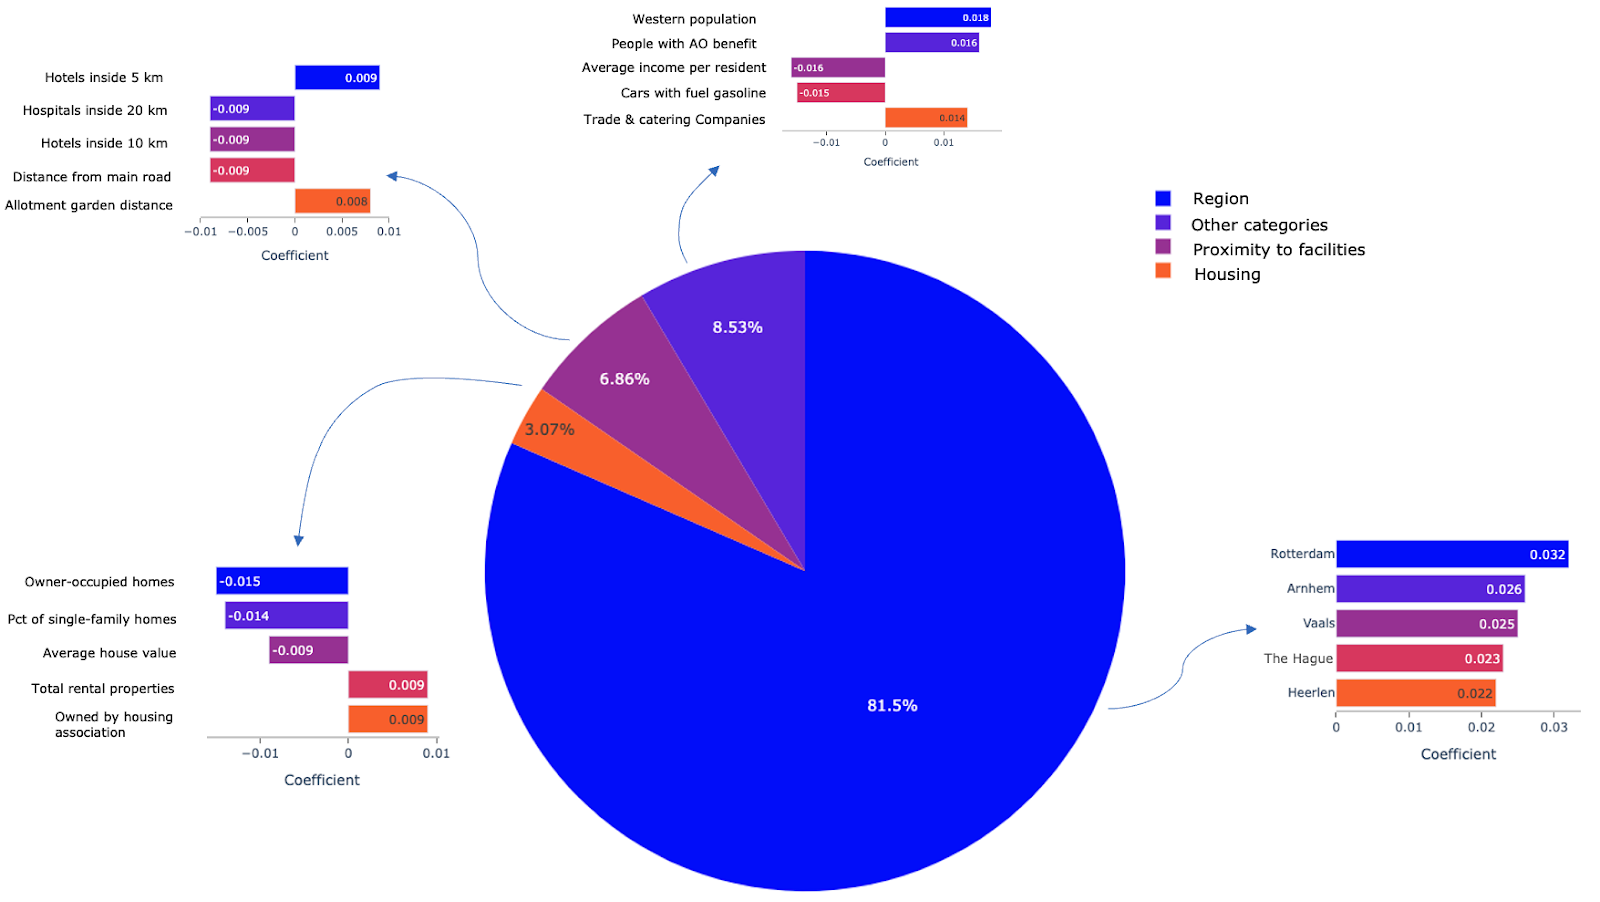
Figure 2: Categories that contribute to having a fraction of households below the social minimum. Within each category, we show the top 5 most important features.
Since our goal was estimating the total number of households below the social minimum, we combined the measurements of the total number of households per municipality with our predictions. The results are shown in the figure below.

Figure 3: Left: Number of households below the social minimum estimated from the model predictions. Right: Comparison of the model estimates with the actual values corresponding to 2023.
Yes, another captivating figure! It was no surprise that the bustling municipalities of Amsterdam, Rotterdam, and The Hague are home to the majority of households in need of VBN assistance. This was expected, given that these urban hubs accommodate a significant population of the country. However, the estimates lack the finesse required to pinpoint the exact locations within these cities. And what about the quantity and the type of food needed by these vulnerable families? To answer this, we are currently building a more detailed model that predicts the fraction of vulnerable households at a district level.
Benefits of Kickstart AI’s model
Long story short: we have developed a model to predict the fraction of households below the social minimum in each Dutch municipality. This model not only reveals the factors influencing vulnerability in our country, but it also offers a lot of other insights. How can VBN utilize this model? One approach is to start evaluating the situation in the municipalities with the higher number of households below the social minimum. According to our model, these municipalities are Amsterdam, Rotterdam, The Hague, Groningen, and Utrecht. Are there enough Food banks in these regions? How close are the local food banks to the districts where the vulnerable households are located? Further analysis in collaboration with VBN is needed to answer these questions.
And there is more, because our model can also benefit NGOs dedicated to supporting vulnerable individuals and affected municipalities. Armed with insights into contributing factors, these organizations can focus their efforts on assisting people from Western backgrounds by securing more jobs or subsidies. However, there is a gap in awareness among internationals about all the allowances provided by local municipalities. By spreading this information through public spaces, in multiple languages, or on municipal websites, we can narrow the gap and extend a helping hand to those in need.
Curious about more technical insights from Kickstart AI's data scientist, read our previous blog on our collaboration with VBN.
Curious how Kickstart AI can elevate your organization to the next level? We’re always open for coffee, so let’s connect soon!